

An ICP scoring rubric is a weighted scorecard that assigns every account in your addressable market a number — usually 0 to 100 — based on how closely it matches your ideal customer profile. It turns “we think this looks like a good fit” into a repeatable, defensible score that sales, marketing, and RevOps can all act on the same way.
If you’ve ever sat in a pipeline review where marketing calls a lead “qualified” and sales calls the same account “a waste of a call,” you already know the problem this solves. Two teams, two mental models of what a good customer looks like, and no shared number to settle the argument. That’s the gap an ICP scoring rubric is built to close.
This guide walks through what the rubric actually measures, how to weight it, a fully worked numeric example you can adapt with your own numbers, and how to tell whether the model you built is actually working — not just whether it looks tidy in a slide deck.
What Is an ICP Scoring Rubric? (Definition)
An ICP scoring rubric is a documented, weighted table of criteria — firmographic, technographic, and behavioral — that converts a qualitative “ideal customer profile” into a quantitative score for every account in your total addressable market. Instead of a paragraph describing your best customer, you get a number: an account might score 88 out of 100, another might score 34, and that gap tells your team exactly where to spend time.
It’s worth being precise about what this is not. An ICP description — “mid-market B2B SaaS companies with 100–500 employees” — is a segment definition. It tells you the shape of the market you’re aiming at. An ICP scoring rubric goes further: it assigns point values to each attribute inside that segment, so two accounts that both technically fit the description can still land at very different scores depending on tech stack, growth stage, or engagement history.
A useful way to think about why this matters: research on B2B go-to-market maturity suggests a large share of B2B companies still operate without a clearly documented ICP at all, running mostly on tribal knowledge and gut feel about which accounts are worth pursuing. That’s fine at ten customers. It falls apart the moment more than one person is doing outbound, because “gut feel” doesn’t transfer between people — a number does.
A quick example of how this plays out: a cybersecurity SaaS vendor selling to mid-market companies will typically score healthcare, finance, and enterprise-technology accounts higher than, say, a small local retailer, because those verticals carry stronger compliance and security requirements that map directly to the product’s value. The rubric encodes that judgment once, so every rep applies it consistently instead of reinventing it account by account.
ICP Scoring vs. Lead Scoring vs. Intent Scoring (Why the Distinction Matters)
This is where a lot of teams get tangled, so it’s worth untangling early.
ICP scoring measures structural fit at the company level: does this account look like our best customers, independent of anything they’ve done so far? It answers “should we sell to this account at all.”
Lead scoring measures engagement at the individual level: has this specific person opened emails, visited pricing pages, downloaded content? It answers “is this person warming up.”
Intent scoring measures timing: is something happening right now — a funding round, a hiring surge, a spike in category research — that suggests this account is actively in-market.
The reason the distinction matters in practice: a person can score extremely high on engagement while working at a company that will never buy. An intern at a five-person startup can open every email, attend every webinar, and download every asset you publish — a traditional lead-scoring model rates that as “hot.” An ICP scoring model looks past the enthusiasm and flags the account itself as a poor structural fit, regardless of how engaged the individual is.
| Dimension | ICP Scoring | Lead Scoring | Intent Scoring |
|---|---|---|---|
| Unit of measurement | Company/account | Individual person | Company/account |
| What it answers | Should we sell to them? | Is this person engaged? | Is now the moment? |
| Data source | Firmographic + technographic data | Email opens, page visits, form fills | Hiring signals, funding events, research surges |
| Changes over time? | Rarely (structural) | Continuously | Yes — decays quickly |
| Best used for | Prioritizing which accounts to pursue at all | Prioritizing which contacts to engage | Timing outreach and campaigns |
In a mature GTM motion, these three layers stack: ICP scoring decides which accounts belong in your pipeline in the first place, lead scoring tells you which people at that account to talk to, and intent scoring tells you when to reach out. Treating any one of them as a substitute for the others is the most common structural mistake in B2B scoring programs.
The Core Dimensions of an ICP Scoring Rubric
Most working rubrics converge on four to seven dimensions. Here’s the version that covers the ground almost every B2B SaaS team needs, in roughly descending order of how “structural” (slow-changing) versus “dynamic” (fast-changing) each one is.
Firmographic Fit
This is the foundation layer, and it’s usually the highest- or second-highest-weighted dimension in a mature rubric — often somewhere around a quarter to a third of total points. Firmographic fit covers:
- Industry / vertical — which sectors actually buy and retain
- Company size — employee headcount and revenue band
- Geography — where your product, support, and compliance posture actually work
- Growth stage / funding stage — a Series B company rebuilding its tech stack behaves very differently from a Series D company optimizing an existing one
Firmographic fit is deliberately weighted heavily because it’s the hardest thing to change. A company in the wrong industry, at the wrong size, with no budget authority in the room, isn’t going to close no matter how many intent signals it throws off. Firmographics set the floor of the score; other dimensions determine how much higher an account climbs above that floor.
Technographic Fit
Technographic fit looks at what tools, platforms, and systems the target account already runs. This matters directly for SaaS products, because so many of them depend on integrations or displace an adjacent tool. If your product works best alongside Salesforce, HubSpot, AWS, or Slack, accounts already running those systems deserve a meaningfully higher score than accounts with no compatible stack — the implementation lift is lower and the “why now” case is easier to make.
This dimension is consistently one of the more underweighted categories in immature scoring models, and one of the more predictive ones in mature ones. A DevOps tool, for instance, should score a company running a compatible CI/CD pipeline noticeably higher than a company with no detectable relevant stack at all, even if both companies are otherwise identical on paper.
Behavioral & Intent Signals
This layer covers what the account is doing: content downloads, pricing-page visits, demo requests, hiring for relevant roles, or a recent funding event. Behavioral and intent data are best layered on top of structural fit rather than used as a primary qualifier — they tell you readiness and timing, not whether the account belongs in your pipeline at all.
The detail most rubrics miss here is decay. An intent signal is perishable. A rubric with no decay logic will rank a six-month-old webinar attendance the same as yesterday’s pricing-page visit, which quietly inflates scores for accounts that have actually gone cold — a pattern documented as one of the most common silent failures in scoring models. A simple fix many teams use is a 30-day decay window on behavioral points, so stale signals stop propping up a score that no longer reflects reality.
Negative / Disqualifying Signals
This is the dimension most competing frameworks treat as an afterthought — and it shouldn’t be. Negative signals are attributes that actively subtract points or trigger an automatic disqualification: wrong geography you don’t support, a company far outside your workable size range, no detectable budget authority, or a known churn pattern in that segment.
The goal of a good rubric isn’t only to rank accounts well — it’s to disqualify fast. A model that only adds points and never subtracts them will happily rank a technically-engaged-but-structurally-wrong account above accounts that are quietly a much better fit. Building disqualifiers directly into the scoring logic, rather than as a manual override step later, keeps reps from spending cycles on accounts that were never going to close.
How to Weight and Score Each Dimension (Worked Example)
Here’s where most guides on this topic stop at percentages. This section shows the actual math, using a single fictional account so you can see exactly how a rubric turns raw attributes into a routing decision.
Assume this weighting split (a reasonable starting point for a mid-market B2B SaaS company; you should recalibrate against your own closed-won data rather than copy this exactly):
- Firmographic fit — 30% of total score
- Technographic fit — 25% of total score
- Behavioral/intent signals — 30% of total score
- Relationship/engagement depth — 15% of total score
- Negative signals — applied as a flat deduction, not a percentage
Fictional account: “Meridian Analytics,” a Series C data-infrastructure company, 220 employees, HQ in Austin, TX.
| Criterion | Max points | Points awarded | Notes |
|---|---|---|---|
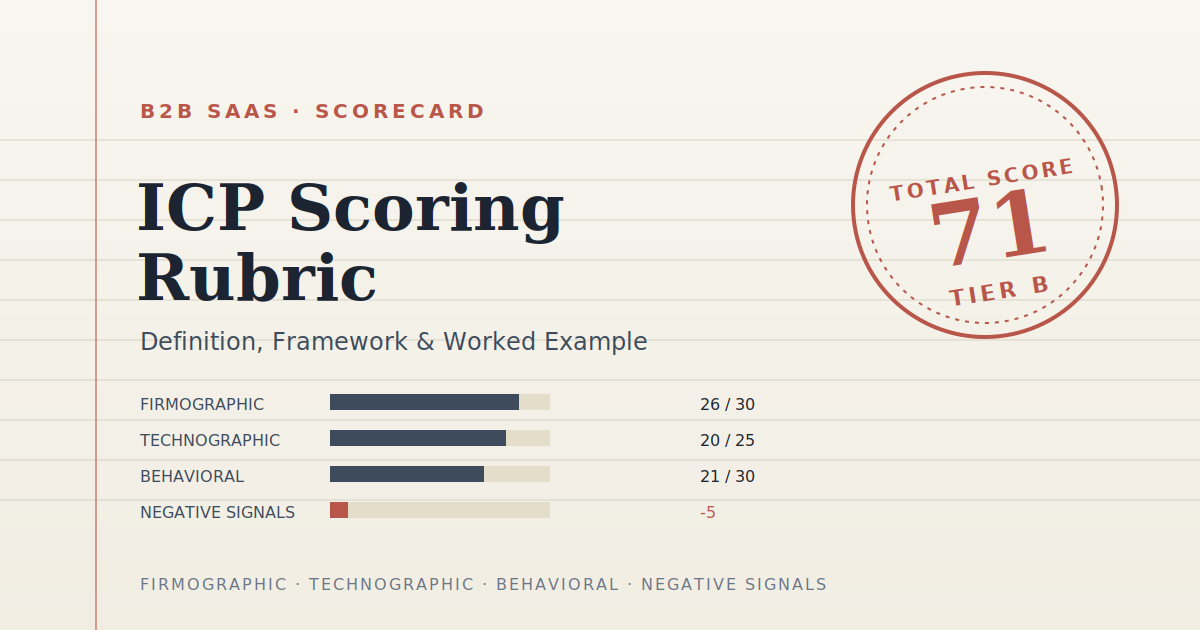
| Firmographic (30 pts max) | 26 | ||
| — Industry match (data/analytics SaaS) | 12 | 11 | Strong vertical match |
| — Headcount in target range (100–500) | 10 | 9 | 220 employees, solidly inside range |
| — Funding stage (Series C target) | 8 | 6 | Slightly later stage than ideal Series B |
| Technographic (25 pts max) | 20 | ||
| — Uses Salesforce (required integration) | 15 | 15 | Confirmed via enrichment data |
| — Uses a compatible cloud provider | 10 | 5 | Partial match, secondary provider detected |
| Behavioral/Intent (30 pts max) | 21 | ||
| — Pricing page visit (within 14 days) | 12 | 12 | Fresh signal, no decay applied |
| — Content download (webinar, 5 months ago) | 10 | 3 | Decayed — beyond 30-day full-value window |
| — Hiring surge for “RevOps” roles | 8 | 6 | Active job postings detected |
| Relationship/Engagement (15 pts max) | 9 | ||
| — Existing contact engagement history | 15 | 9 | Moderate email engagement, no prior demo |
| Negative signals | — | −5 | Geography slightly outside primary supported region |
| Total score | 100 | 71 |
Resulting tier: With typical thresholds of 80–100 = Tier A (priority, immediate AE routing), 60–79 = Tier B (qualified, standard sequence), below 60 = Tier C (nurture only), Meridian Analytics lands in Tier B — a real, qualified opportunity, but not an immediate white-glove routing case. That’s a materially different action than treating every “engaged” account the same way, which is exactly the failure mode ICP scoring is built to prevent.
This is the mechanism to copy: score each sub-criterion against its own max, apply decay where the signal is time-sensitive, subtract for disqualifiers, and only then sum to a total. The weighting percentages matter less than making sure every account goes through the same transparent math.
Where the Data for Each Dimension Actually Comes From
A rubric is only as good as the data feeding it, and the four dimensions above pull from genuinely different sources. It helps to separate them clearly before you start scoring anything by hand.
Firmographic data is the most commercially available layer — industry codes, headcount, revenue bands, and funding stage are all fields that standard B2B enrichment providers (Apollo, ZoomInfo, Clearbit, and similar tools) populate reasonably reliably. This is usually the easiest dimension to automate first, and the one worth getting right before layering anything more dynamic on top.
Technographic data is a step less complete — enrichment providers can detect a meaningful share of a company’s public-facing stack (CRM, marketing automation, cloud provider), but internal tooling choices are often invisible from the outside. Treat technographic scores as directional rather than exact, and weight accordingly if your enrichment coverage is patchy.
Behavioral and intent data comes from two different places that are worth keeping separate in your own thinking, even if they feed the same score. First-party behavioral data — pricing-page visits, content downloads, demo requests — comes from your own website analytics, marketing automation platform, and CRM activity logs. Third-party intent data — category research surges, hiring signals, funding announcements — comes from external providers. First-party signals are generally more predictive because they reflect direct interest in your product specifically, not just the category.
Negative signals often require the least tooling and the most judgment — they’re usually a short, deliberately curated list (unsupported geography, headcount far outside range, industries with a documented pattern of poor retention) rather than something an enrichment API hands you automatically.
A practical starting point for a lean team without a full RevOps stack: pull firmographic and technographic data from a single enrichment provider, layer in whatever first-party behavioral data your CRM already logs, and treat third-party intent data as a later addition once the core model is validated — not a prerequisite to getting started.
Who Should Own the Rubric
This is worth stating explicitly, because ownership gaps are a common reason models quietly decay after launch. The rubric itself — the weights, the thresholds, the recalibration schedule — is best owned by a single function, usually RevOps or a demand-gen/marketing-ops lead, even though the inputs (what a good account looks like) should be defined jointly with sales.
Split ownership without a single accountable owner is how two teams end up back at square one: marketing quietly adjusts a weight to hit a lead-volume target, sales stops trusting the score, and within two quarters everyone is back to working off gut feel. Whoever owns it should also own the quarterly review meeting where score-tier-to-win-rate data gets reviewed out loud, not just checked privately.
Turning the Rubric Into a Live Score (Operationalizing It)
A rubric that lives in a spreadsheet or a slide deck changes nothing. The value only shows up once the score is a field in the CRM that updates automatically, drives routing rules, and is visible to the reps who act on it day to day. The rollout sequence that tends to hold up regardless of which CRM or enrichment stack you’re using:
- Agree the definition jointly. Sales and marketing co-author the ICP and the point values in the same room. The most common failure isn’t a badly designed model — it’s two teams quietly using different definitions of “a good lead” and discovering the mismatch months later.
- Encode it. Turn the rubric into a scoring field (or a small set of fields) inside the CRM, populated from enrichment data where possible rather than manual entry.
- Automate the routing. Tier A accounts should trigger immediate senior-AE assignment and high-touch sequences; Tier B accounts route to standard sequences; Tier C accounts go to nurture, not a rep’s desk.
- Govern it. Assign an owner (usually RevOps) responsible for reviewing and recalibrating the model on a set cadence, not “whenever someone complains.”
How to Validate and Recalibrate the Model
A rubric that hasn’t been checked against real outcomes is just an opinion with a number attached. Before rolling it out across your full pipeline, run it backward against accounts you already have outcomes for:
- Score your closed-won accounts. If your best, stickiest customers aren’t landing in the 80–100 range, your weights are wrong somewhere.
- Score your closed-lost and churned accounts. If a meaningful share of them score just as high as your closed-won accounts, the model isn’t actually distinguishing fit from noise.
- Compare conversion rates by tier, not just averages. Track win rate for Tier A vs. Tier B vs. Tier C specifically — if higher-scoring accounts aren’t converting at a visibly better rate than lower-scoring ones, the model needs recalibration, not just more data.
- Adjust weights, not just thresholds, when the model misfires. If technographic fit turns out to correlate far more strongly with your actual win rate than firmographic fit does, its weight should move accordingly — the percentages in the worked example above are a reasonable starting point, not a fixed law.
- Recalibrate on a set cadence. Quarterly is a practical default for most B2B SaaS teams; recalibrate sooner if you enter a new market, launch a new product, or see a sharp shift in your customer base.
Markets move. Your best-fit customer profile from two quarters ago may not be your best-fit customer profile now — the rubric needs to be treated as a living model, not a one-time project.
Common Mistakes When Building an ICP Scoring Rubric
- The ICP is too broad to be useful. “Mid-market B2B SaaS” describes a market segment, not a targeting instruction. If the definition doesn’t exclude anyone, it doesn’t help anyone.
- Sales and marketing quietly use different definitions. This is the single most common root cause of pipeline friction — not a flawed model, but two unaligned ones running in parallel.
- No negative signals. A rubric that only adds points will over-rank technically-engaged-but-wrong-fit accounts.
- No decay logic. Stale intent signals inflate scores for accounts that have actually gone cold.
- The model never leaves the slide deck. Without CRM integration and routing automation, even a well-designed rubric changes nothing about day-to-day rep behavior.
- Weights copied from a benchmark, never validated. Generic percentage splits are a reasonable starting point, not a substitute for checking the model against your own closed-won data.
FAQs
What is an ICP scoring rubric in B2B SaaS? It’s a weighted scorecard, typically scaled 0–100, that scores every account in your addressable market against firmographic, technographic, and behavioral criteria to measure how closely it matches your ideal customer profile.
How is ICP scoring different from lead scoring? ICP scoring measures whether a company is structurally a good fit, independent of any individual’s behavior. Lead scoring measures how engaged a specific person is. A company can be a strong ICP fit even if no one there has engaged yet, and a person can be highly engaged at a company that’s a poor ICP fit.
What dimensions should an ICP scoring model include? At minimum: firmographic fit, technographic fit, behavioral/intent signals, and negative/disqualifying signals. Many teams add a relationship or engagement-depth dimension as a fifth category.
How often should you recalibrate an ICP scoring model? Quarterly is a common default, checked against closed-won, closed-lost, and churned account data. Recalibrate sooner after entering a new market, launching a new product, or seeing a meaningful shift in your customer base.
Can ICP scoring be automated? Yes — most teams populate the scoring fields from enrichment data (firmographic and technographic attributes) and CRM/marketing-automation activity data (behavioral signals), then automate routing based on tier thresholds.
What score should trigger sales handoff? There’s no universal number, but a common starting pattern is 80–100 for immediate AE routing, 60–79 for standard sales sequences, and below 60 for marketing nurture only — validated and adjusted against your own conversion data over time.
Last reviewed: July 2026. Scoring weights and thresholds in this guide are illustrative starting points — validate them against your own closed-won data before rolling out to your full pipeline.
 faizanhumi@gmail.com