

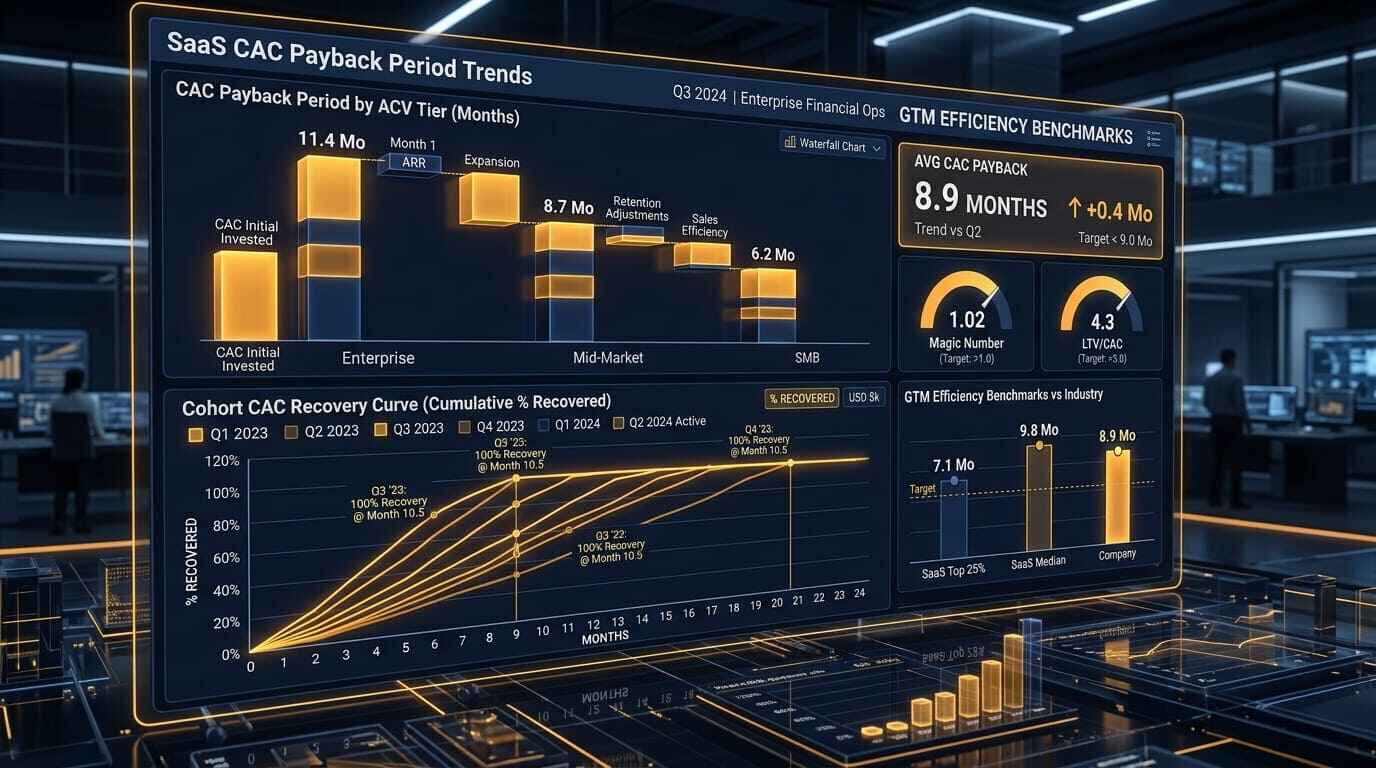
The SaaS CAC payback period has quietly become the most consequential metric on every Series B term sheet, M&A information memo, and board deck being reviewed in 2026. While ARR growth dominated investor conversations for most of the last decade, the compression of public SaaS revenue multiples — from a 2021 peak down to 5.5x ARR for the SaaS Capital Index in Q1 2026 — has permanently shifted the frame. Investors are no longer grading growth alone. They are grading the efficiency of growth, and the SaaS CAC payback period is the metric that makes that efficiency visible.
According to the 2026 Aleph × Benchmarkit SaaS & AI Performance Benchmarks report, drawing on 342 B2B SaaS and AI-native software companies, the median B2B SaaS company now recovers its customer acquisition cost in 16 months — with top-quartile operators achieving payback in under 6 months and the bottom quartile stretching beyond 24.That gap between the median and the top quartile is the story of 2026 SaaS: the companies that have built capital-efficient acquisition machines are pulling further ahead of those still running on the growth-at-all-costs model, and the SaaS CAC payback period is where the gap shows up first.
This guide gives you the complete picture: what the SaaS CAC payback period actually measures, how to calculate it correctly, what the 2026 benchmarks look like across ACV tiers and GTM motions, and which levers compress payback most effectively — with data from across the SaaS industry to back every recommendation.
What Is the SaaS CAC Payback Period and Why Does It Matter in 2026?
The SaaS CAC payback period is the number of months required to recover the total cost of acquiring a customer through the gross profit that customer generates. It is the answer to the question every CFO and investor asks before committing capital to a growth motion: how long does my money sit at risk before it comes back?
The formula is straightforward:
SaaS CAC Payback Period = CAC ÷ (ARPU × Gross Margin)
Where CAC is the total sales and marketing spend divided by the number of new customers acquired in a given period, ARPU is average revenue per user per month, and gross margin is expressed as a decimal. The result is the number of months before the customer has generated enough gross profit to cover their acquisition cost.
The reason the SaaS CAC payback period has become the defining GTM efficiency metric in 2026 is the direct connection to capital requirements. As Tomasz Tunguz has articulated clearly: a SaaS business with a six-month payback period needs only $2.6M of working capital to fund a given growth rate, while a twelve-month payback ties up $7.8M for the same growth. Every month of payback extension is a direct tax on the capital efficiency of the growth motion, paid in either equity dilution or burn rate.
The SaaS CAC payback period has also become the metric that investors use to distinguish between two types of SaaS company that can look identical at the ARR line: those with durable, compounding unit economics, and those burning through capital to manufacture temporary growth that will not survive the next fundraising cycle.
SaaS CAC Payback Period Benchmarks 2026: The Complete Data Set
Understanding where your SaaS CAC payback period sits relative to benchmarks requires looking at the data by ACV tier, growth rate, and GTM motion — not just the all-company median. The all-company median of 15–16 months hides enormous variation that makes it nearly useless as a benchmark for any individual company.
By ACV Tier
The relationship between deal size and SaaS CAC payback period is real but not linear, and understanding the nonlinearity is important for setting appropriate targets:
- Sub-$5K ACV (SMB/self-serve): 8–12 month median payback. High-volume, low-touch digital acquisition recovers CAC quickly despite small deal sizes. PLG companies in this tier achieve 6–12 month payback with median CAC of $702.
- $5K–$25K ACV (mid-market, lower): 12–15 month median payback. The transition zone where self-serve begins to require sales-assisted conversion for meaningful deal sizes.
- $25K–$100K ACV (mid-market, upper): 15–18 month median payback. Longer evaluation cycles and field-sales costs push payback out, though the 25th percentile of 15 months shows efficient acquisition is achievable.
- $100K–$250K ACV (enterprise): 18–24 month median payback. Justified by 3–5x lower churn and 4–5x higher LTV compared to SMB.
- $250K+ ACV (strategic enterprise): 22–30 month median payback. The longest cycles and highest acquisition costs, fully offset by multi-year contract structures and expansion economics.
The critical benchmark principle: horizontal B2B SaaS recovers CAC faster at the median — 14 months versus 18 months for vertical SaaS. The tradeoff is that vertical SaaS earns it back through retention, posting a higher lifetime-value-to-CAC ratio of 5.6x versus 4.1x for horizontal. SaaS CAC payback period should always be read alongside LTV:CAC, not in isolation.
For the complete GTM efficiency dataset behind these benchmarks, see the Bessemer Venture Partners Atlas SaaS benchmarking framework
By Growth Rate
The 2026 data reveals a counterintuitive pattern in the relationship between growth rate and SaaS CAC payback period:
- 40%+ growth: Fastest payback — top-quartile operators recovering CAC in under 6 months. Fast-growing companies are not buying growth with inefficient acquisition; they have built acquisition machines that compound.
- 21–30% growth: Median payback of 22 months — the worst cohort. Companies in this band are often absorbing elevated CAC to find their next growth gear before efficiency gains catch up.
- Under 20% growth: Payback stretches to 24+ months for bottom-quartile operators. Below-median growth with high payback is the capital efficiency danger zone.
By GTM Motion
| GTM Motion | Median CAC | Median Payback | LTV:CAC |
|---|---|---|---|
| PLG (self-serve) | $702 | 6–12 months | 4–5x |
| Sales-assisted (mid-market) | $4,200–$8,500 | 14–18 months | 4.2x |
| Enterprise sales | $11,400 | 18–36 months | 5–6x |
Bessemer Venture Partners Scoring Framework
The Bessemer framework, used as the canonical reference on Series B term sheets, rates SaaS CAC payback period as follows:
- 0–6 months: Best — elite capital efficiency
- 6–12 months: Better — strong competitive position
- 12–18 months: Good — within acceptable range for most investors
- 18–24 months: Concerning — requires explanation and improvement plan
- 24+ months: Critical — structural GTM problem requiring immediate action
How to Calculate Your SaaS CAC Payback Period Correctly
The formula for SaaS CAC payback period is simple. Getting the inputs right is where most finance teams introduce systematic error — and the errors almost always overstate efficiency.
Step 1: Calculate True CAC
True CAC includes every cost associated with acquiring a customer:
- All sales headcount costs: salaries, commissions, benefits, and management overhead
- All marketing spend: paid acquisition, content production, event costs, tooling
- Sales and marketing technology: CRM licences, intelligence platforms, SEO tools
- Allocated overhead for sales and marketing operations
The most common CAC calculation error is excluding sales headcount costs and counting only paid media spend. This understates CAC by 40–60% for most B2B SaaS companies with quota-carrying sales teams, producing a payback figure that is materially more optimistic than the economic reality.
CAC = Total Sales & Marketing Spend (period) ÷ New Customers Acquired (period)
Use the same period for both inputs. Quarterly calculation smooths seasonality better than monthly.
Step 2: Calculate ARPU × Gross Margin
ARPU (Average Revenue Per User per month) should use contracted MRR from new customers only — not blended ARPU across the entire customer base, which includes expanded accounts that are not relevant to acquisition payback.
Gross margin must reflect the fully-loaded cost of delivery: hosting infrastructure, customer success costs allocated to the first year, support costs, and — critically in 2026 — AI inference costs for AI-native SaaS products. Traditional SaaS companies clear 77–81% gross margin. LLM-native companies are seeing inference costs drag gross margin to approximately 52%, which directly extends SaaS CAC payback period and changes what a healthy payback target even means.
Monthly Gross Profit per Customer = ARPU × Gross Margin
Step 3: Apply the Formula
SaaS CAC Payback Period (months) = CAC ÷ (ARPU × Gross Margin)
Step 4: Validate with Cohort Analysis
The formula-based SaaS CAC payback period is a forward-looking estimate. Cohort analysis validates it with actual cash recovery data: track monthly cohorts of new customers, measure the cumulative gross profit each cohort generates month by month, and identify the month at which cumulative gross profit crosses the total CAC paid to acquire that cohort. The cohort-validated payback period is the number that belongs in your board deck.
The Five Levers That Compress SaaS CAC Payback Period
In my 20 years of experience as a Finance Manager scaling technical infrastructure, the SaaS CAC payback period improvement projects that deliver the most durable results are those that address the formula at the gross margin and conversion efficiency levels — not those that simply cut acquisition spend. Cutting spend compresses the numerator but often reduces growth velocity in ways that create worse problems at Series A and B. The levers that matter are the ones that improve the economics of each acquired customer, not just the cost of acquiring them.
Lever 1: Gross Margin Optimisation
Moving gross margin from 72% to 78% shortens SaaS CAC payback period by 4.3 months at typical unit economics. At $500 ARPU, 72% margin produces $360 monthly contribution per customer. 78% margin produces $390. The 8.3% contribution lift compresses payback proportionally without touching acquisition spend at all.
The mechanisms: hosting cost optimisation through reserved instance procurement and workload right-sizing, support automation through AI-powered tier-1 resolution, and pricing tier consolidation that eliminates low-margin product configurations. For AI-native SaaS companies, inference cost optimisation — model selection, caching, batching — is the highest-impact gross margin lever available in 2026.
Lever 2: Product-Led Growth Conversion
PLG acquisition channels produce SaaS CAC payback periods of 6–12 months at a median CAC of $702 — compared to 14–22 months for sales-led acquisition at $4,200–$11,400 CAC. Shifting even 20–30% of new customer volume to self-serve PLG channels materially changes the blended payback across the portfolio.
The connection between PLG adoption and SaaS CAC payback period is one of the most direct unit economics relationships in the GTM stack. The product-led growth architectures that drive the best payback periods combine freemium or free trial acquisition with Product Qualified Lead routing for sales-assisted conversion — capturing the cost efficiency of self-serve activation while using sales resources only at the moment of maximum commercial leverage.
Lever 3: Activation and Onboarding Optimisation
Time-to-value is the most underappreciated driver of SaaS CAC payback period. Customers who activate quickly — who reach their first meaningful outcome within 30 days of contract signature — generate their first renewal conversation from a position of demonstrated value rather than aspiration. Cohorts with fast activation show 15–25% higher first-year retention rates, which compresses effective payback period even when the formula-based calculation does not change.
The onboarding investment required to accelerate activation is also one of the lowest-cost interventions available. Dedicated onboarding specialists for enterprise accounts, automated milestone-based activation sequences for mid-market, and self-serve resource libraries for SMB — none of these require material headcount additions, but all produce measurable improvements in the retention component of the payback calculation.
Lever 4: Net Revenue Retention Architecture
Improving net revenue retention from 100% to 120% shortens effective SaaS CAC payback period by 2–4 months through the net-versus-gross math. Customers who expand — adding seats, consuming more, adopting adjacent product modules — generate gross profit in excess of their contracted ARPU, which shortens the actual time to full CAC recovery even if the formula-based calculation uses contracted ARPU only.
The expansion revenue architecture that drives NRR above 120% is covered in detail in the context of SaaS net revenue retention benchmarks — the metrics, the playbooks, and the customer success infrastructure that create the expansion flywheel. For SaaS CAC payback period purposes, the critical design decision is whether expansion revenue is the result of a deliberate commercial motion or an accidental outcome of customers growing. Deliberate expansion programmes consistently outperform accidental ones by 30–40% on NRR.
Lever 5: AI-Driven Acquisition Cost Compression
Companies deploying AI agents for lifecycle email, ad copy generation, and SEO content production report 3–5 months shorter SaaS CAC payback period per ICONIQ 2026 data. The compression comes from three sources: 8–12% lower acquisition cost through better ad creative, 40–60% lower content production cost reducing total CAC inputs, and 15–25% higher email conversion rates generating more revenue from existing pipeline.
The pricing model also affects payback dynamics directly. The shift toward consumption-based and outcome-based pricing — explored in detail in AI SaaS pricing strategy — changes when revenue is recognised and when CAC recovery is complete. Consumption-based models with strong usage growth produce effective payback periods shorter than the formula suggests, because actual monthly gross profit from expanding accounts exceeds the contracted ARPU used in the calculation.
SaaS CAC Payback Period by Stage: What to Target at Each ARR Milestone
The appropriate SaaS CAC payback period target shifts as a company scales, reflecting the changing cost of capital, the maturity of the GTM motion, and the investor expectations at each fundraising stage.
$0–$3M ARR (Pre-Seed to Seed): Target under 12 months. At this stage, capital is most expensive (highest dilution per dollar raised) and the GTM motion is still being validated. Elite operators at this stage — companies like TestGorilla in their early growth phase — have demonstrated payback periods as short as 80 days by combining very low-CAC inbound channels with rapid activation. The benchmark to chase is 8–12 months, with anything under 6 months signalling genuine product-market fit in the acquisition channel.
$3M–$10M ARR (Seed to Series A): Target 12–15 months. Series A investors use SaaS CAC payback period as a primary signal of GTM efficiency and a predictor of Series B fundability. Companies at this stage that cannot demonstrate a path to sub-12-month payback will face questions about GTM scalability that affect both valuation and terms.
$10M–$25M ARR (Series A to Series B): Target 15–18 months for mid-market GTM, 10–14 months for PLG-primary motion. The Series B benchmark has tightened significantly in 2026. Companies with payback above 20 months at $15M+ ARR face valuation compression and increased investor scrutiny about the durability of the growth model.
$25M–$100M ARR (Series B to Series C): Target 12–16 months blended across GTM motions. At this scale, the composition of the payback period — what percentage comes from self-serve versus sales-assisted versus enterprise — matters as much as the absolute number. Investors at Series C are building a financial model of the business at $200M+ ARR and using the current payback composition to project capital requirements at scale.
Multi-Currency Investment Benchmarks:
| Stage | Investment to Compress Payback | USD | GBP | EUR |
|---|---|---|---|---|
| Seed | GTM tooling + PLG infrastructure | $40K–$80K/yr | £31K–£62K/yr | €37K–€74K/yr |
| Series A | Sales intelligence + onboarding programme | $80K–$200K/yr | £62K–£155K/yr | €74K–€185K/yr |
| Series B | Full GTM stack + CS platform | $200K–$500K/yr | £155K–£387K/yr | €185K–€462K/yr |
Common SaaS CAC Payback Period Mistakes That Inflate Your Numbers
The four-error cascade that silently overstates payback period efficiency — making companies look better than they are to themselves and investors — is one of the most consistent patterns in SaaS finance reviews.
Error 1: Excluding Headcount from CAC. Using paid media spend only, without sales salaries and commissions, understates CAC by 40–60%. This produces a payback period that looks strong in the board deck but does not reflect the actual cash cost of acquisition.
Error 2: Using Blended ARPU. Applying company-wide average ARPU rather than new-customer contracted ARPU inflates the denominator. Mature customers with expanded accounts pull blended ARPU above what new customers actually pay, producing an optimistic payback calculation.
Error 3: Ignoring Gross Margin Compression. For AI-native SaaS companies with significant inference costs, using a historical gross margin assumption rather than the current fully-loaded margin understates the payback denominator. A company with 65% fully-loaded gross margin that uses 80% in its payback calculation is understating payback by approximately 3–4 months.
Error 4: Not Segmenting by ACV. Blending enterprise and SMB customers into a single payback calculation produces a number that is misleading in both directions — too optimistic for the enterprise motion, too pessimistic for the SMB motion. Always segment SaaS CAC payback period by ACV tier and GTM channel for operational utility.
Strategic Outlook & Implementation
In my 10 years of experience as a Manager scaling technical infrastructure, the SaaS CAC payback period conversation in 2026 represents the clearest signal I have seen that the SaaS industry has permanently matured past the growth-at-all-costs era. The companies commanding premium valuations — 7x to 10x ARR at Series C — are those that can demonstrate both strong NRR above 110% and SaaS CAC payback period under 12 months simultaneously. Either metric alone, even when strong, does not earn the same premium in the current market. The combination is what investors are pricing.
My implementation recommendation for SaaS founders is to build the SaaS CAC payback period calculation directly into the monthly operating rhythm, not just the quarterly board deck. The metric earns its keep as a rolling indicator of GTM health — a single quarter is noisy, but a trend across four quarters tells you whether the acquisition machine is compressing or decompressing. Finance teams that have this metric updating in real time from their CRM and billing systems make better GTM investment decisions than those rebuilding the calculation manually for each board cycle.
For Series A and Series B founders specifically, the SaaS CAC payback period has become the number that investors use to decide whether your GTM motion is fundable at the multiple your ARR growth rate implies. A 40% growth rate with a 22-month payback period will not command the same multiple as a 40% growth rate with a 10-month payback period — the capital efficiency difference is priced explicitly into term sheets in 2026. Building a credible improvement plan for SaaS CAC payback period — with specific lever identification, monthly tracking, and cohort-validated progress data — is as important as the ARR narrative in the fundraising process.
The AI-era dimension requires additional strategic attention. For SaaS companies with significant LLM-based features, gross margin compression from inference costs is the most underappreciated driver of SaaS CAC payback period deterioration in 2026. Companies that have not explicitly modelled the inference cost component of their gross margin, and built a roadmap for managing it as usage scales, are carrying a hidden payback period risk that will surface at Series B diligence. Model it explicitly, own the narrative, and demonstrate the optimisation pathway before an investor surfaces it as a concern.
Frequently Asked Questions About SaaS CAC Payback Period in 2026
What is a good SaaS CAC payback period in 2026? Bessemer Venture Partners rates under 12 months as good, under 6 months as best, and over 24 months as critical. The 2026 median across 342 B2B SaaS companies sits at 15–16 months, meaning sub-12-month payback gives a clear competitive and valuation advantage. The appropriate target depends on ACV tier: SMB-focused companies should target 8–12 months, mid-market companies 12–18 months, and enterprise companies 18–24 months — with the enterprise payback justified by lower churn and higher LTV:CAC ratios.
How do you calculate SaaS CAC payback period correctly? The formula is: CAC ÷ (ARPU × Gross Margin). CAC must include all sales and marketing costs — headcount, paid media, tooling, and allocated overhead. ARPU should use new-customer contracted MRR only, not blended company-wide average. Gross margin must be fully loaded including hosting, inference costs for AI features, and allocated support costs. Validate the formula-based calculation with cohort analysis showing actual cash recovery month by month.
Why has SaaS CAC payback period stretched in 2026? Multiple structural factors have extended median payback from 11 months in 2021 to 15–16 months in 2026: rising paid acquisition costs across all major platforms, tighter privacy targeting regulations reducing conversion efficiency, longer average B2B sales cycles (now 134+ days), and the re-pricing of SaaS revenue multiples that has eliminated the ability to fund long payback periods with cheap growth capital. AI inference costs are adding an additional gross margin compression factor for LLM-native companies.
Does a longer SaaS CAC payback period always indicate a problem? Not necessarily. Enterprise companies with $100K+ ACV routinely run 18–24 month payback periods — justified by 3–5x lower churn rates and 4–5x higher LTV:CAC compared to SMB. A long payback is a structural problem only when it exceeds the benchmark for your ACV tier, is trending in the wrong direction quarter-over-quarter, or cannot be justified by a demonstrably higher LTV:CAC ratio. Always benchmark within your ACV and GTM motion cohort, not against the all-company median.
What is the fastest way to improve SaaS CAC payback period? The highest-leverage improvements in order of typical impact: (1) gross margin optimisation — moving gross margin from 72% to 78% shortens payback by 4+ months; (2) PLG channel development — self-serve acquisition at $702 median CAC versus $4,200–$11,400 for sales-led; (3) activation and onboarding acceleration — faster time-to-value improves retention which shortens effective payback; (4) NRR improvement above 120% — expansion revenue shortens effective payback through above-contracted gross profit generation; (5) AI-driven acquisition cost compression — 8–12% lower acquisition cost and 15–25% higher conversion from AI-optimised creative and email.
Conclusion
The SaaS CAC payback period in 2026 is not a back-office metric — it is the primary lens through which investors, acquirers, and operationally rigorous founders evaluate whether a SaaS business is building a compounding machine or consuming capital to manufacture temporary growth. The gap between the top-quartile operator recovering CAC in under 6 months and the bottom-quartile operator taking 24+ months is not a gap in growth ambition. It is a gap in acquisition architecture, gross margin management, and retention engineering.
The benchmarks are clear. The levers are well-understood. The companies that have moved their SaaS CAC payback period below 12 months while sustaining 30%+ growth are the ones commanding 7–10x ARR multiples, attracting the best term sheet terms, and building the capital efficiency that makes the next growth phase genuinely sustainable rather than burn-dependent.
The path to a best-in-class SaaS CAC payback period runs through five levers: gross margin optimisation, PLG channel development, activation acceleration, NRR architecture above 120%, and AI-driven acquisition cost compression. None of these require cutting growth investment. All of them require making growth investment smarter — measuring it correctly, segmenting it honestly, and improving it systematically. That is the operational discipline that separates the SaaS companies that will define the 2026–2028 market cycle from those that will struggle to raise at the multiples their ARR growth implies.
About the Author
Hi, I’m Ghulam Fareed. Over the last 10 years as a Manager and Digital Growth Specialist, I’ve focused on scaling technical B2B SaaS properties and navigating complex architectures. My work sits at the intersection of enterprise finance, AI infrastructure strategy, and operational efficiency — helping organizations translate SaaS ambition into auditable, scalable, cost-effective outcomes. I write at SaaS Latest News to share frameworks that enterprise leaders can apply immediately, not just read and file away.